Articles
It's not the network - troubleshooting slow apps with packet captures
5 min read
When web apps are slow, it’s usually not the network. Here’s how to prove it.
Is it the network, or the application? This question is so common that “it’s not the network” is a meme among IT professionals and developers alike.

If you’re writing a web application or trying to debug why an app is slow, using packet captures to view http flows and analyze response times gives a direct way to isolate - and show - the real problem.
Find slow application performance with HTTP flows
When a slow application becomes an issue, take a network packet capture of the user’s session or during your development tests. You can use a number of different tools to record the network traffic, depending on where you can and should capture. Once you’ve gathered a capture of the session, upload it to your CloudShark system (or a CloudShark Personal account).
Now you want to look at the http flows to find the interaction between the http client (e.g., a browser request or API call) and the server. You can do this with the “Protocol Conversations” tool under “Analysis Tools” if you know the IP addresses of the client and server. If you have a lot of conversations in the capture, or aren’t sure where to start looking, you can start with the Zeek Logs tool to quickly look just for HTTP conversations.
Profiles and Presets
http.time is one of the columns we've added to CloudShark's HTTP preset, that you can find when editing the profile used to look at a capture. You can use this to instantly select what you need for HTTP analysis.
Adding http.time to your capture view
The http response time is the delta time between when an http request is transmitted, and when the http response is transmitted. Calculating it accurately is done while decoding the packets, and this value is stored in a field called http.time in the http response packet.
Let’s take a look at this capture. We’ve added a custom column called “HTTP Time” which contains the value of http.time.
To add this column to our view, we can add a custom field by clicking on Profile–>Custom Columns in the capture viewer. We then add a custom column here:

You can order the fields at the top of that dialog window. When you’re done, click save at the bottom.
We’ve also added the field http.request_in as the column called “Request Frame”. We’ll explain why in a moment.
Since http.time is contained within the http response packets, we want to look only at the http responses, using this filter:
https://www.cloudshark.org/captures/3658274a4436?filter=http.response
Show the results by graphing http response time
To get a good view of http response times, we can create a graph. CloudShark lets you graph on things like number of bytes, number of packets, etc., but it will also lets you graph on the average value of numeric fields.
In this graph, we’ve created a filter using the AVG (average) function. The syntax we put in the graph for the y-axis is like this:
AVG(http.time)http.time
To get the graph to chart this correctly, we set the y-axis drop down to “value”. The overall settings look like this:

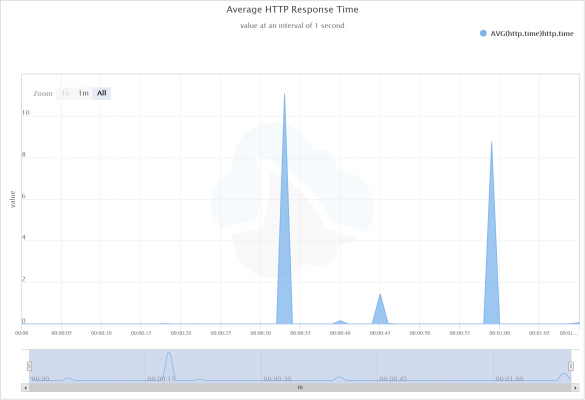
This creates a graph of our average http response times over the duration of the capture:

Digging deeper
What can be learned here? Large HTTP Response times could be due to network delay, but with a web app, it’s most likely that the application is taking a long time to process the request.
How can we find out what the problem is? Let’s look at that big spike in the average response time. Since it’s the average at that time in the capture, we can make a guess as to what a good threshold would be to find the outliers at that time (let’s pick 6 seconds, since that’s about halfway up the spike).
Using our threshold, we can then build a filter to find those responses that had a time greater than 6 seconds:
https://www.cloudshark.org/captures/3658274a4436?filter=http.time%20%3E%206
Remember our http.request_in column that we added? We can use that to associate the response with the packet that contained the request. Now we know which GET requests caused those long responses! We can put them altogether using the in operator in our filter:
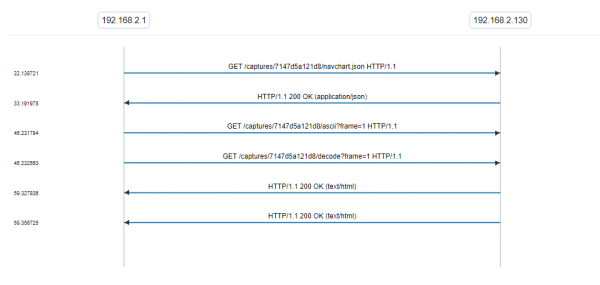
Armed with this, we can point our engineers at a specific GET request that had an exceedingly long response time, maybe getting to the root of a web app issue. Better yet, we can give them a ladder diagram view of the whole problem:

Another example: TCP vs HTTP packets`
The steps outlined here are great for debugging a complex application problem. What if you need some quick, definitive proof that it’s “not the network?”
In this case we can use packet captures to compare the speed at which a TCP connection was acknowledged versus how long the HTTP server takes to respond. Take a look at this capture and follow Tom’s annotations. You can see the difference clearly just by sharing two different capture views!
Reporting the issue
Armed with evidence of delayed HTTP responses, you can link to the capture views, just like we have above, in any of your reports about the issue. Saving the graphs you make and linking to them directly as well will help prove to everyone involved that is was, in fact, not the network.
Photo credit Sebastian Herrmann via Unsplash
Want articles like this delivered right to your inbox?
No spam, just good networking.