Webinars
Network Troubleshooting with Aerohive Hivemanager NG and CloudShark
6 min read
If you deploy Aerohive devices in your network, solving problems using network captures will get it done faster. Aerohive’s integration with CloudShark makes it easy to actually work with real network traces. Watch our in-depth seminar above on how to solve a real-world problem using HiveManger NG and CloudShark.
Why use packet captures to solve problems?
One of the things we’ve often encountered here at CloudShark is that not everyone involved in IT or in managing networks is familiar with the why of packet captures. Consider this quote from Gerald Combs, one of the lead developers of Wireshark - the software that most people learn when they start learning about the usefulness of packets:
“Often times, PACKET CAPTURES are used as a LAST RESORT, when really they should be a FIRST or SECOND.”
What he says here is telling - packets really are the best way to get to the root of a problem. So why are they used as a last resort?
Cloud managed networks need cloud managed capture
The answer is that they are difficult to collect, share, and work with. This pain is acutely felt in the explosion of cloud managed Wifi and cloud managed networks, which are quickly becoming the norm. These systems allow their access points to connect to a cloud-based management system, making it easy to manage, monitor, and configure them from anywhere, usually right in a browser. But how can we easily debug network problems that arise on these systems, when they are remotely distributed? You want to take captures and get access to them, but that’s often hard to do without special software, and trying to use something like a Wifi probe very rarely gets you all of the data you need. Moreover, you can’t get the unencrypted data easily. Equally difficult is trying to grab captures from mobile sources.
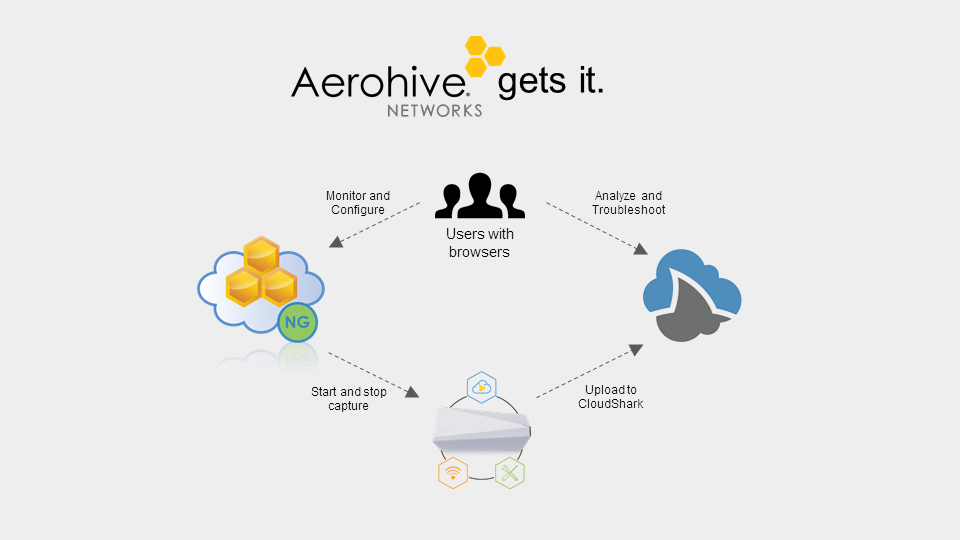
The folks at Aerohive get it when it comes to this problem. They’ve added native packet capture and CloudShark integration to their platform via their Hivemanager NG dashboard, where users can be monitoring their APs, see a problem, run a capture, and send it to CloudShark where the analysis happens all without leaving your browser. They’ve done this because they understand how important it is to be able to do this sort of thing, and that pcaps should be one of the first things you use, not the last report when getting to the root of a problem.
Solving a real problem faster with packet captures
In our example, we have a ticket in from a user that says they can no longer login to our intranet. The user was able to login before, and now they are complaining that they can’t.
Step one - replicate the behavior while doing a capture
First, we’re going to have the user go through the steps again, but this time, we’ll be ready to start a capture in our HiveManager NG Dashboard (under Tools–>Remote Capture), by selecting the AP the user is connected to.
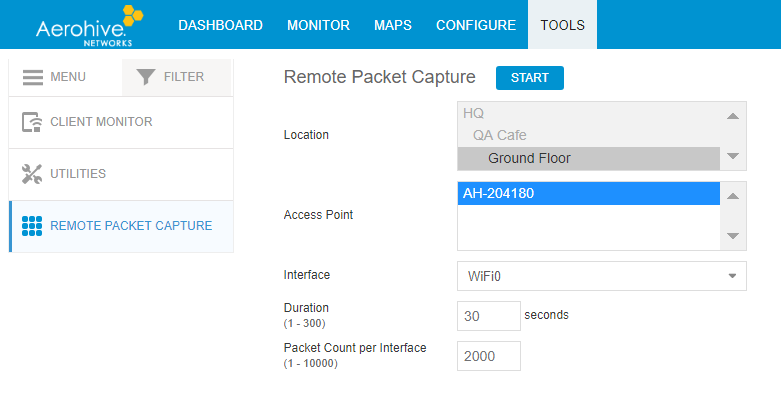
The nice thing is that since we’re using HiveManger NG to manage the AP, we don’t have to install any special software for the user, or even go to the user’s site: the entire thing can be done over chat or over the phone.
We tell the user to try again and set a capture for 30 seconds just to be sure. Aerohive gives a link to the resulting capture.
Step two - drill down with filters
You can see our example here:
https://www.cloudshark.org/captures/8dc12f3dc969
This is the whole capture. One nice thing about Aerohive’s embedded capture tool is that the AP has all the information it needs to decrypt the data, and does so for us automatically (something very difficult to do with WiFi probes).
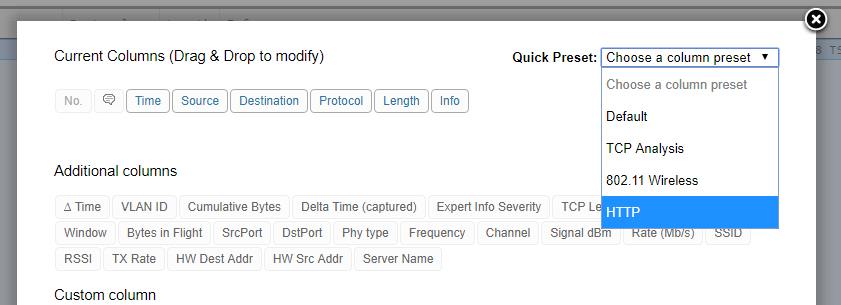
Now of course that’s the whole capture; we know that the problem is with a web application so we’re going to change our CloudShark column pre-sets to “http” (under Profile–>Column Presets):
To narrow things down, let’s look at the Endpoints tool. Everything in CloudShark is a URL so we can point you directly at it with this link:
https://www.cloudshark.org/analysis/8dc12f3dc969/endpoints?ladder=false
Clicking on “172.16.0.65”, which is the address we know for the intranet server. This automatically builds a filter for us of just its traffic:
https://www.cloudshark.org/captures/8dc12f3dc969?filter=ip.addr%20%3D%3D%20172.16.0.65
We can see right away from all of those TCP Retransmissions that something is up. We know that the user is trying to login over http, so we’re going to add that to our filter by adding “&& http” in the white filter box. This give us this view:
Step three - follow stream
You can see our annotation there that since the user is using http, their password is being sent in the clear! You can see this plainly with the follow stream tool (Analysis –> Follow Stream), which is what we did first:
https://www.cloudshark.org/analysis/8dc12f3dc969/follow?stream=0&proto=http
You can see that after they attempt to login, there is an http redirect, telling the browser to instead use https, rather than http. That’s a big clue, and also a good idea, because then we’d never have seen their password. Perhaps the application team changed the server to force HTTPS?
Step four - look for what’s expencted
If HTTPS was requested, then we’d see some SSL (Secure Socket Layer) or TLS (Transport Layer Security) packets after the redirect occurs, right? Adding that to the filter with “(http || ssl)”, however, shows no SSL traffic.
Well maybe it’s something other than SSL, so let’s instead look at the known port that HTTPS runs over, Port 443.
Ah ha. Now we see where those Retransmissions are coming from: there’s no response from the server. That means the server is either not listening, or access to it is being blocked my something in the middle.
Step five - check the policy of the AP
To test this, we try to go to the server ourselves, and see that everything is working fine, so the problem is that something is blocking access between this particular user and the server.
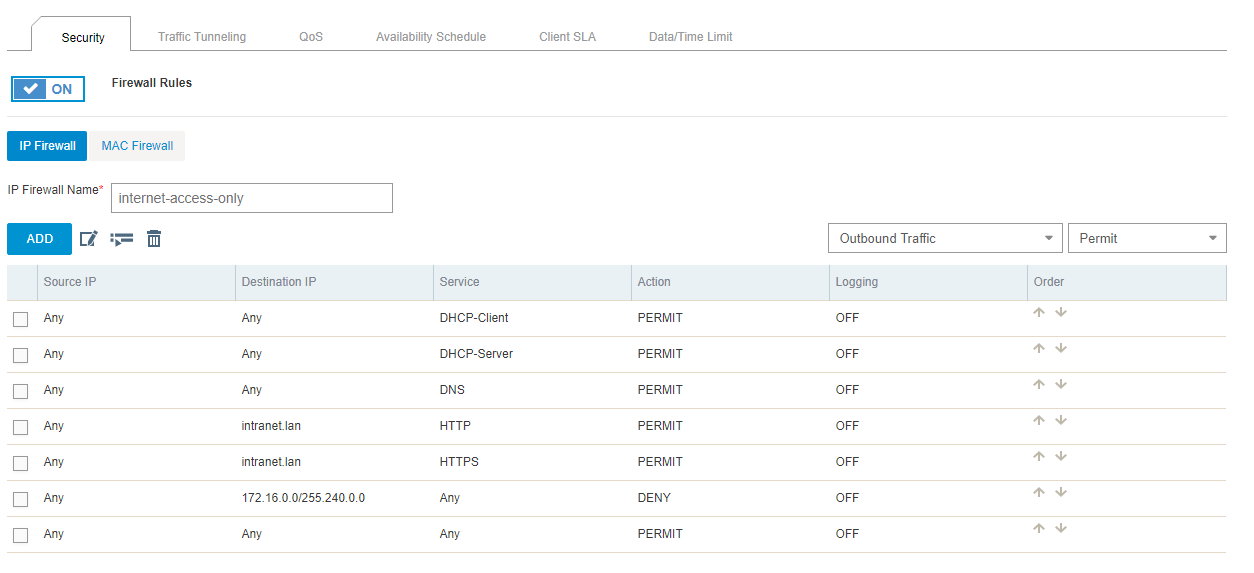
So what do we do? Let’s look at the firewall settings on AP the user is accessing by using our HiveManger NG Dashboard (Configure–>Select Policy–>Wireless Settings–>Select AP–>User Access Settings):
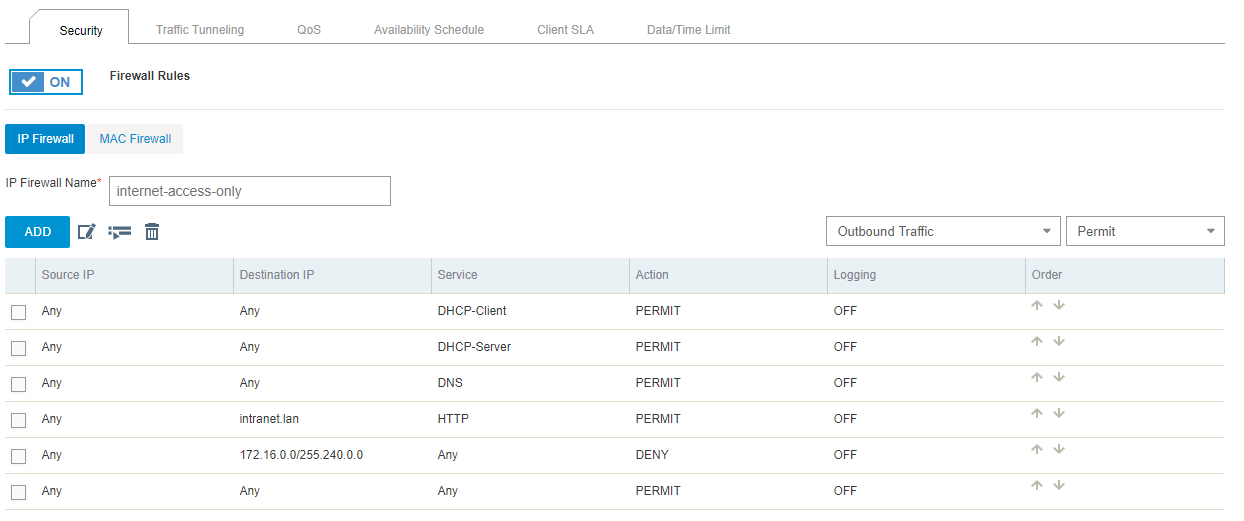
We can see here that the policy allows HTTP, but not HTTPS! Now we know what to fix by adding that rule to allow HTTPS:
Step six - sanity check and follow up
Now we have the user try again while taking another capture. After the firewall change, the user reports they can now access the server. However, their initial password is being sent in the clear, so maybe we should file a ticket with the application team to make sure the redirect happens before the user tries to log in. The nice thing here is we have the evidence, complete with a note pointing right at it:
The bottom line: the packets don’t lie
With the right tools, packet captures can be a fast and powerful troubleshooting resource. What may have taken days took us about 20 minutes. Hivemanager NG makes it easy to get to the packets, even on remote systems, with its CloudShark integration. When it comes to dealing with packets, CloudShark makes it simple to collaborate, communicate, and solve problems.
Want articles like this delivered right to your inbox?
No spam, just good networking.