Articles
Using Follow Stream for Packet Capture Analysis
6 min read
When getting to the heart of an application or security problem, finding the right TCP stream and following it using the “Follow TCP Stream” view in CloudShark is usually the place you want to get to in order to see an issue in action, for a great many use cases. But how do you find the right stream, and what should you look for once you’re viewing it?
What is a stream?
A stream refers to the flow of data back and forth over the course of a protocol conversation between two endpoints. It’s generally defined as a “5-tuple” of data used to uniquely identify them:
- Protocol (i.e. TCP or UDP)
- Source IP
- Source port
- Destination IP
- Destination port
Within a capture, those 5 data points will usually identify a single stream. You could specify the entire 5-tuple to filter out a stream, but it’s a lot to type!
As a shortcut, CloudShark indexes each stream to tell them apart. You can use a filter to view only those packets particular to a stream by using this number, such as “tcp.stream == 0” for the first one (the indexing starts at 0). Here’s a filtered example capture showing a single stream:
https://www.cloudshark.org/captures/a03d81e4728f?filter=tcp.stream%20%3D%3D%200
When you use the “follow stream” tool, you will see all of the data that flowed back and forth over the connection for the duration of the connection. This allows you to get a complete picture of an application conversation between two endpoints, such as a client and server.
Finding the right stream
When viewing a packet capture that contains an issue you’re looking for, it’s difficult to know where to start. Follow stream is such an integral analysis tool that it’s built into several other of CloudShark’s tools, letting you “drill down” depending on the issue you’re looking for.
Protocol conversations
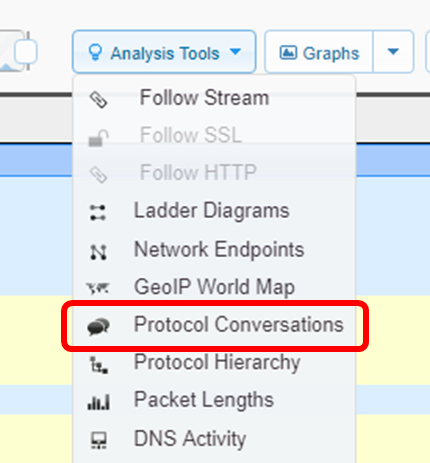
If you know the IP addresses of the systems involved in a stream, you can use the Protocol Conversations tool to find the stream you’re looking for.
Here’s an example of the protocol conversations view (which “we’ve opened in a new window” so we can link to it directly). In the top left, you’ll see a dropdown menu that lets you change the context of the conversations. By default this is set to IP, but we’ve set it to TCP conversations. This becomes part of the URL, so if you send it to someone else, they’ll see what you’re seeing.
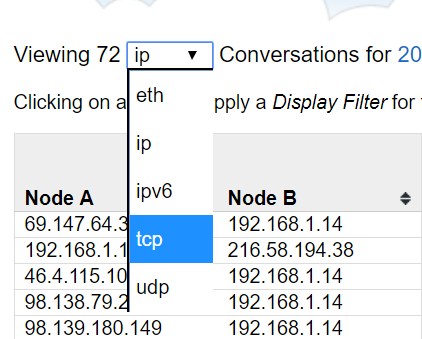
Now we can find the conversation that matches the IP addresses of the two endpoints we’re looking for. Clicking on that conversation will immediately take us to the follow stream view.
Threat vectors
If you’re analyzing a security threat, you can use CloudShark’s threat assessment system to drill down to a stream based on the alert that triggered a threat vector to be produced.
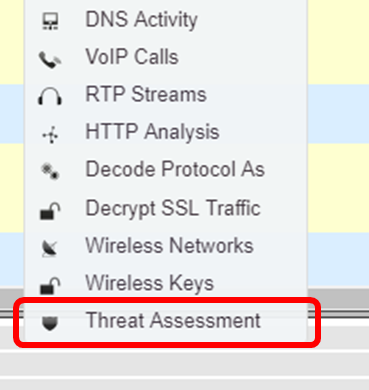
When we select threat assessment and click on “Advanced Analysis” to take us to the threat vector view. You can share the threat vector view just like any other CloudShark URL:.
https://www.cloudshark.org/analysis/a03d81e4728f/threats_vectors
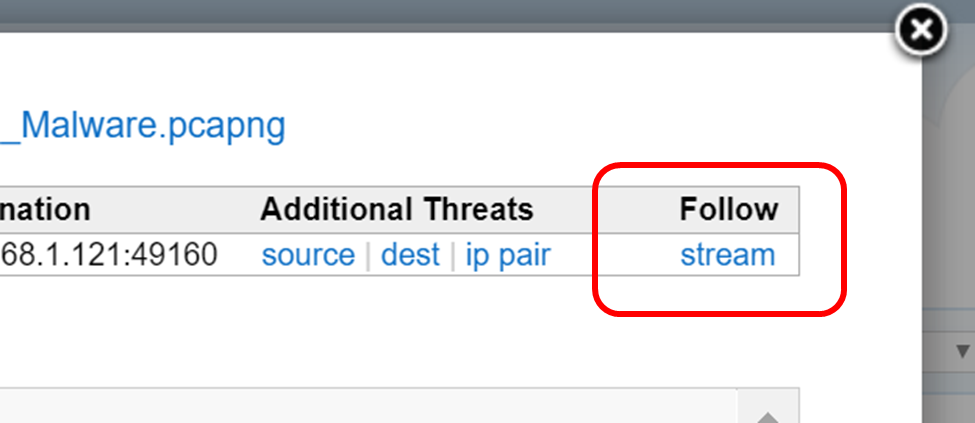
Threat vectors show packet flows that contain traffic that triggered an alert, and shows the endpoints involved. Clicking on a particular vector will bring up more information about the alert. In the row at the top showing the triggering packet, you can click on “follow stream” at the end of the row, which will take you to the follow stream view showing the entire data stream that contains the event that caused the alert.
Clicking on the “Open in new window” button will give us a URL directly to the stream, like this:
Follow TCP vs. Follow HTTP
There are two separate follow stream tools in CloudShark: “Follow TCP Stream” and “Follow HTTP Stream”. What’s the difference? The HTTP stream is specially tailored to decode HTTP information. Often, data sent over HTTP is compressed. In these cases, you’ll see something like this in the HTTP headers:
Content-Type: gzip
If you view a compressed HTTP stream with the “Follow TCP Stream” tool, you will see the actual (compressed) data as a stream of bytes. There may be some cases where this is what you want to look at, but usually, you want to have CloudShark decompress the HTTP data so you can see the actual HTTP messages sent back and forth. To do that, use the “Follow HTTP Stream” tool.
Here’s an example of the difference. First is a “Follow TCP Stream” view of an HTTP stream containing compressed data:
https://www.cloudshark.org/analysis/9630569d9e2a/follow?stream=0&proto=tcp
Here’s how that looks using the “Follow HTTP Stream” tool:
https://www.cloudshark.org/analysis/9630569d9e2a/follow?stream=0&proto=http
In the second one you can see the uncompressed website data - which is probably much more useful. One quick note here; if you see the Follow HTTP Stream tool greyed out, it means you haven’t selected an http packet to follow. A quick way to get there is to set the display filter to http and then choose a packet.
What am I looking for?
Now that you’ve found the right stream, it’s time to begin your analysis. Here’s what the follow stream window looks like:
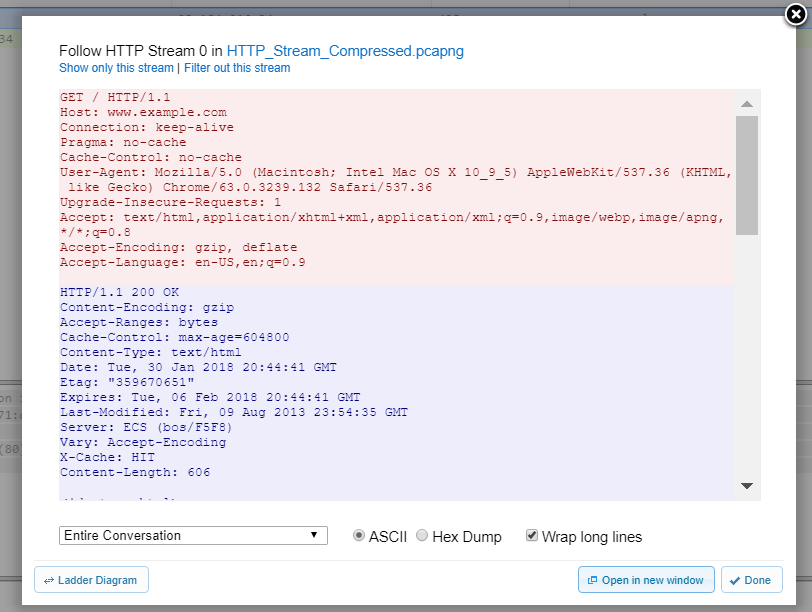
You can see that the data is color coded. The first endpoint to send data is marked in red, and the second is marked in blue. You can choose to view the data as either ASCII text, or as a hex-dump of the raw bytes (this may be useful for applications that are pushing an octet stream over http that is intended to be viewed as such). You can also choose to filter the view to see only one side of the conversation at a time.
Lastly, the “ladder-diagram” button will take you to a graphic view of the packets flowing back and forth over the stream, which is perfect for getting a higher-level look at the flow of data. We’ll cover that in depth in another post!
Obviously, your analysis is of course dependent on the problem you’re trying to solve. If you’re debugging an HTTP application, use “Follow HTTP Stream” to view the entire application conversation over a single connection to see if there were errors in the API calls from the client to the server. If you’re looking at a security issue, you can use the Follow Stream views to look for a phishing attempt or to witness keylogger data being sent to a remote server.
Those are just a few examples, but Follow Stream is one of the most often used tools in your troubleshooting toolkit. And in CloudShark, you can easily collaborate on the problem by sharing the Follow Stream view using just its URL.
What articles like this delivered right to your inbox?
No spam, just good networking